How to Monitor SSD Health on Dedicated Servers: Using smartctl, node_exporter, and Grafana for Proactive Disk Failure Detection
If you're planning to order a dedicated server from Hetzner — or already have — don't assume the hardware is in perfect condition, especially the SSDs. Even 'new' NVMe drives can be heavily worn or nearing failure. It's essential to check disk health immediately after provisioning and set up continuous monitoring from day one.
In this article, I’ll walk you through:
- Manually checking SSD health with smartctl,
- Setting up real-time monitoring with node_exporter and Prometheus,
- Visualizing key disk metrics in Grafana.
With this setup, you’ll be able to:
- Catch issues before deploying production workloads,
- Continuously monitor SSD health over time,
- Collect clear, actionable evidence to request disk replacements before downtime hits.
Manual SSD Health Check Using smartctl
Before diving into automated monitoring, it’s essential to perform a one-time manual inspection of your SSDs using the smartctl utility from the smartmontools package.
What is smartmontools?
It's a handy set of tools that lets you pull S.M.A.R.T.(Self-Monitoring, Analysis and Reporting Technology) data from your drives — things like temperature, wear level, power-on hours, and error stats.
Install smartmontools
On most Linux distributions:
# Debian/Ubuntu
sudo apt update && sudo apt install smartmontools

# CentOS/RHEL
sudo yum install smartmontools

# Arch
sudo pacman -S smartmontools
Listing Drives
Let’s see what drives are available:
sudo smartctl --scan
We have two drives NVMe here:
/dev/nvme0 -d nvme # /dev/nvme0, NVMe device
/dev/nvme1 -d nvme # /dev/nvme1, NVMe device
Get drives health info
To inspect the first drive, run:
sudo smartctl -a /dev/nvme0
The first section contains general information about the device, such as model, firmware version, capacity, and supported features.
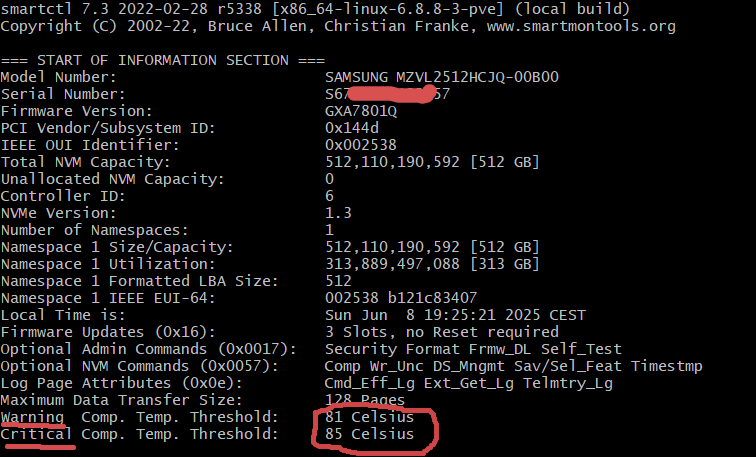
Keep an eye on the warning and critical temperature thresholds here. We'll use them later when setting up alerts.
Next, you'll see the SMART data section:
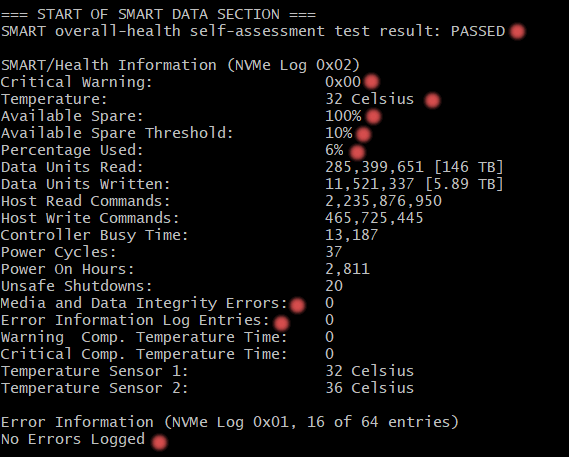
The key things to look at here are:
- Temperature: 32–38°C — totally healthy.
- Available Spare: 100% - shows how much spare capacity the controller has left to replace worn-out cells. If it drops close to the threshold (usually 10%), the drive is at risk.
- Percentage Used is just 6%, which means the drive is still in good shape and far from wearing out.
- Media and Data Integrity Errors are at zero — a good sign that the SSD isn’t silently failing.
- And finally, Critical Warning is
0x00, meaning the drive isn’t reporting any major issues.
Extracting SSD Metrics and Configuring Prometheus Alerts
Key Metrics and Alerts Logic
So, what key metrics should we monitor, and at what points should we trigger alerts? The full list is below:
-
SMART overall-health self-assessment test result — if the status is anything other than PASSED, this should trigger an alert.
-
Critical Warning (0x00 means no warnings) — if this value becomes non-zero, it’s a cause for alarm.
-
Temperature — a crucial metric. You should alert if the temperature exceeds a threshold (typically around 70°C–80°C).
-
Available Spare and Available Spare Threshold — represent the remaining reserve capacity of the drive. An alert should be triggered when Available Spare falls below the threshold.
-
Percentage Used — indicates how much of the drive’s lifespan has been consumed. A warning is needed if this exceeds around 80–90%.
-
Unsafe Shutdowns — critical if the count increases, as it may point to power issues or improper shutdowns.
-
Media and Data Integrity Errors and Error Information Log Entries — any non-zero value here should trigger an alert immediately.
Let's set up the metrics mentioned above for continuous monitoring with Prometheus. I'll use smartctl_exporter for this, but first, we need to install Go if it's not already installed:
wget https://go.dev/dl/go1.24.4.linux-amd64.tar.gz
sudo tar -C /usr/local -xzf go1.24.4.linux-amd64.tar.gz
echo 'export PATH=$PATH:/usr/local/go/bin' >> ~/.profile
source ~/.profile
go version
Install smartctl_exporter:
git clone https://github.com/prometheus-community/smartctl_exporter
cd smartctl_exporter
go build
sudo cp smartctl_exporter /usr/local/bin
Run exporter to collect SMART metrics from both NVMe drives:
sudo smartctl_exporter \
  --smartctl.path="/usr/sbin/smartctl" \
  --smartctl.device="/dev/nvme0n1" \
  --smartctl.device="/dev/nvme1n1" \
  --web.listen-address=":9633"

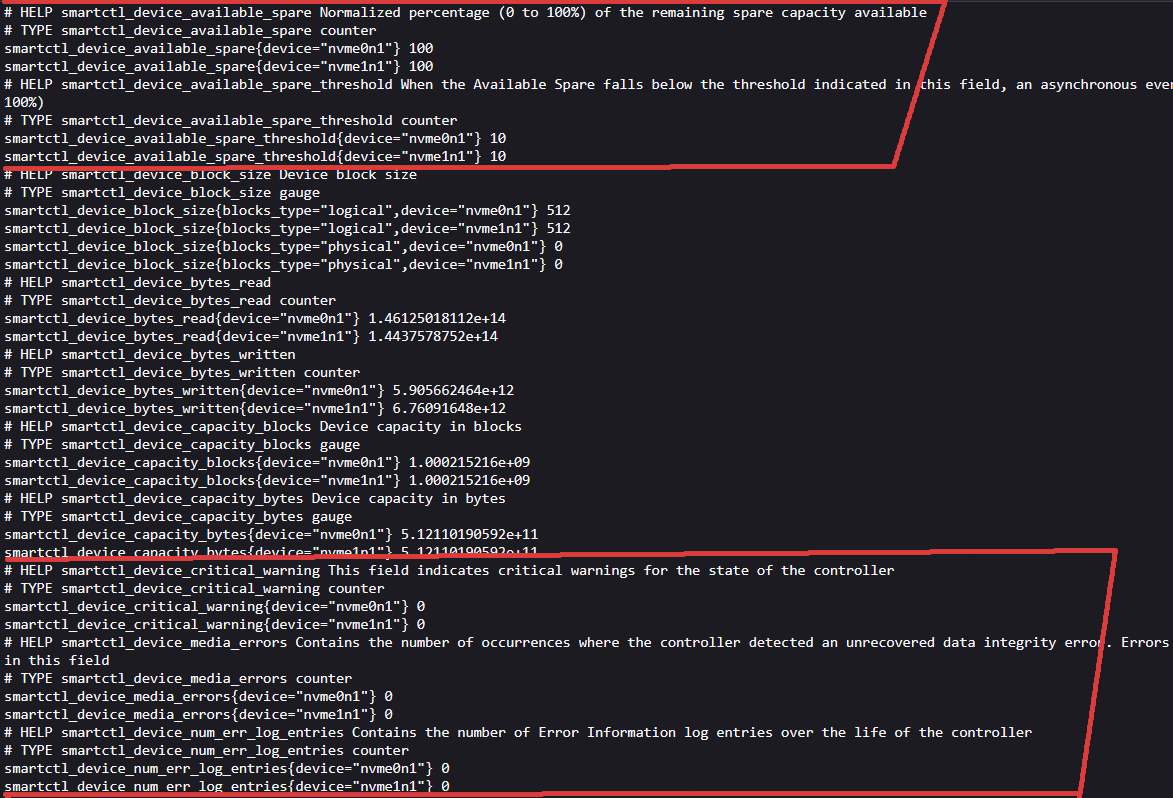
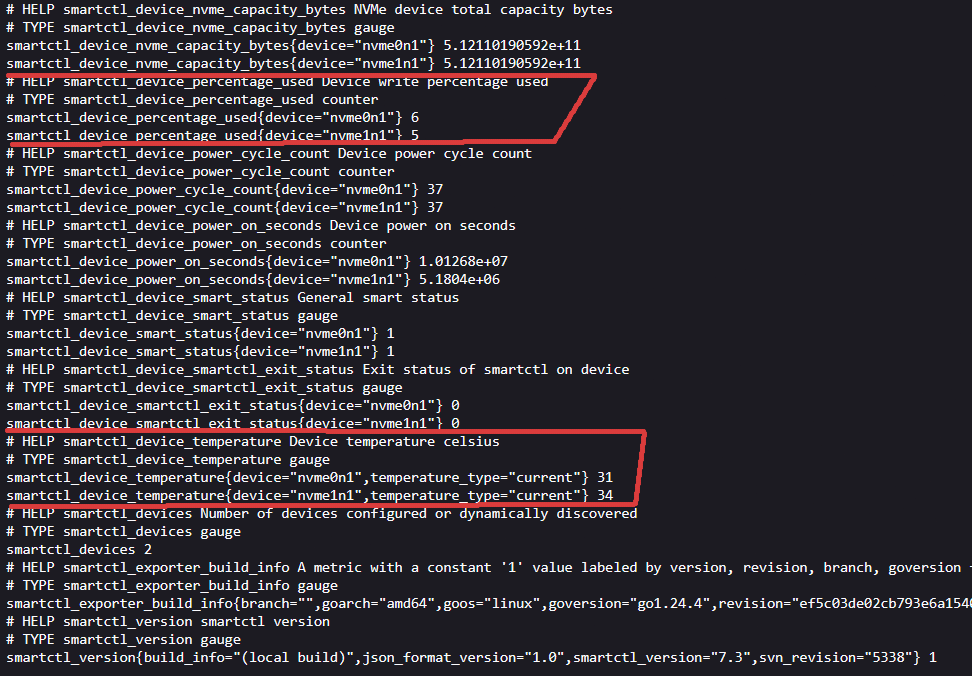
Visit http://your_ip_is_here:9633:
Production security note
In this article, smartctl_exporter is exposed on 0.0.0.0:9633 without TLS or authentication for simplicity and demo purposes.
However, in production environments, it's strongly recommended to protect metrics endpoints. You can:
- Bind to
127.0.0.1and have Prometheus scrape locally. - Use
iptables/firewalld/nftablesto allow access only from Prometheus. - Set up a reverse proxy (e.g., Nginx or Caddy) with HTTPS and basic auth.
- Consider mTLS for stricter environments.
Leaving metrics endpoints open to the public is a serious security risk, as they may leak hardware or infrastructure details.
Systemd for smartctl_exporter
In order to continous providing smartctl metrics let's setup systemd service using your favorite editor:
sudo vim /etc/systemd/system/smartctl_exporter.service
Paste the following:
[Unit]
Description=smartctl_exporter for Prometheus
After=network.target

[Service]
Type=simple
ExecStart=/usr/local/bin/smartctl_exporter \
  --smartctl.path=/usr/sbin/smartctl \
  --smartctl.device=/dev/nvme0n1 \
  --smartctl.device=/dev/nvme1n1 \
  --web.listen-address=:9633
Restart=on-failure
User=root

[Install]
WantedBy=multi-user.target
Enable the service:
sudo systemctl daemon-reload
sudo systemctl enable smartctl_exporter
sudo systemctl start smartctl_exporter
Check it:
sudo systemctl status smartctl_exporter
All done — we’re now ready to collect SMART metrics with Prometheus.
Prometheus scraping SMART data and firing alerts
OK, let's configure Prometheus to start scraping the exporter, in your prometheus.yml, inside scrape_configs, add:
- job_name: 'smartctl'
  static_configs:
  - targets: ['your_ip_is_here:9633']
  relabel_configs:
  - source_labels: [__address__]
    regex: '.*'
    target_label: instance
    replacement: 'smartctl'
Then, create a new file named smart_alerts.yml and paste the following alert rules into it:
groups:
  - name: smartctl_nvme_alerts
    rules:

      # Alert if NVMe wear level exceeds 80% (used lifespan)
      - alert: NVMEWearLevelHigh
        expr: smartctl_device_percentage_used >= 80
        for: 10m
        labels:
          severity: warning
        annotations:
          summary: "High NVMe wear level on {{ $labels.device }} ({{ $value }}%)"
          description: "The drive {{ $labels.device }} has reached {{ $value }}% of its designed write endurance. Plan replacement soon."

      # Alert if current temperature exceeds safe limits (> 80°C)
      - alert: NVMEHighTemperature
        expr: smartctl_device_temperature{temperature_type="current"} > 80
        for: 5m
        labels:
          severity: warning
        annotations:
          summary: "High temperature on NVMe {{ $labels.device }} ({{ $value }}°C)"
          description: "The current temperature of {{ $labels.device }} exceeds the safe threshold (80°C). Check airflow and cooling."

      # Alert on SMART critical warning bit (e.g. power loss, overheating, etc.)
      - alert: NVMECriticalWarning
        expr: smartctl_device_critical_warning != 0
        for: 1m
        labels:
          severity: critical
        annotations:
          summary: "SMART critical warning for {{ $labels.device }}"
          description: "SMART reported a critical warning on device {{ $labels.device }}. Immediate attention required."

      # Alert on media errors (e.g. read/write failures)
      - alert: NVMEMediaErrors
        expr: smartctl_device_media_errors > 0
        for: 2m
        labels:
          severity: warning
        annotations:
          summary: "Media errors detected on {{ $labels.device }}"
          description: "Media-level errors have been reported on {{ $labels.device }}. This may indicate degraded flash cells."

      # Alert if SMART overall status is failed (should be 1 if OK)
      - alert: NVMESmartStatusFailed
        expr: smartctl_device_smart_status != 1
        for: 1m
        labels:
          severity: critical
        annotations:
          summary: "SMART health check failed on {{ $labels.device }}"
          description: "The SMART status of {{ $labels.device }} indicates a failure. Consider immediate replacement."

      # Alert if available spare blocks drop below threshold
      - alert: NVMESpareBlocksLow
        expr: smartctl_device_available_spare < smartctl_device_available_spare_threshold
        for: 5m
        labels:
          severity: warning
        annotations:
          summary: "Available spare blocks low on {{ $labels.device }}"
          description: "Spare capacity on {{ $labels.device }} dropped below the critical threshold. Replace the drive soon."
Make sure to include smartctl_alerts.yml in the rule_files section of your prometheus.yml:
rule_files:
  - "rules/other_rules.yml"
  - "rules/smartctl_alerts.yml"
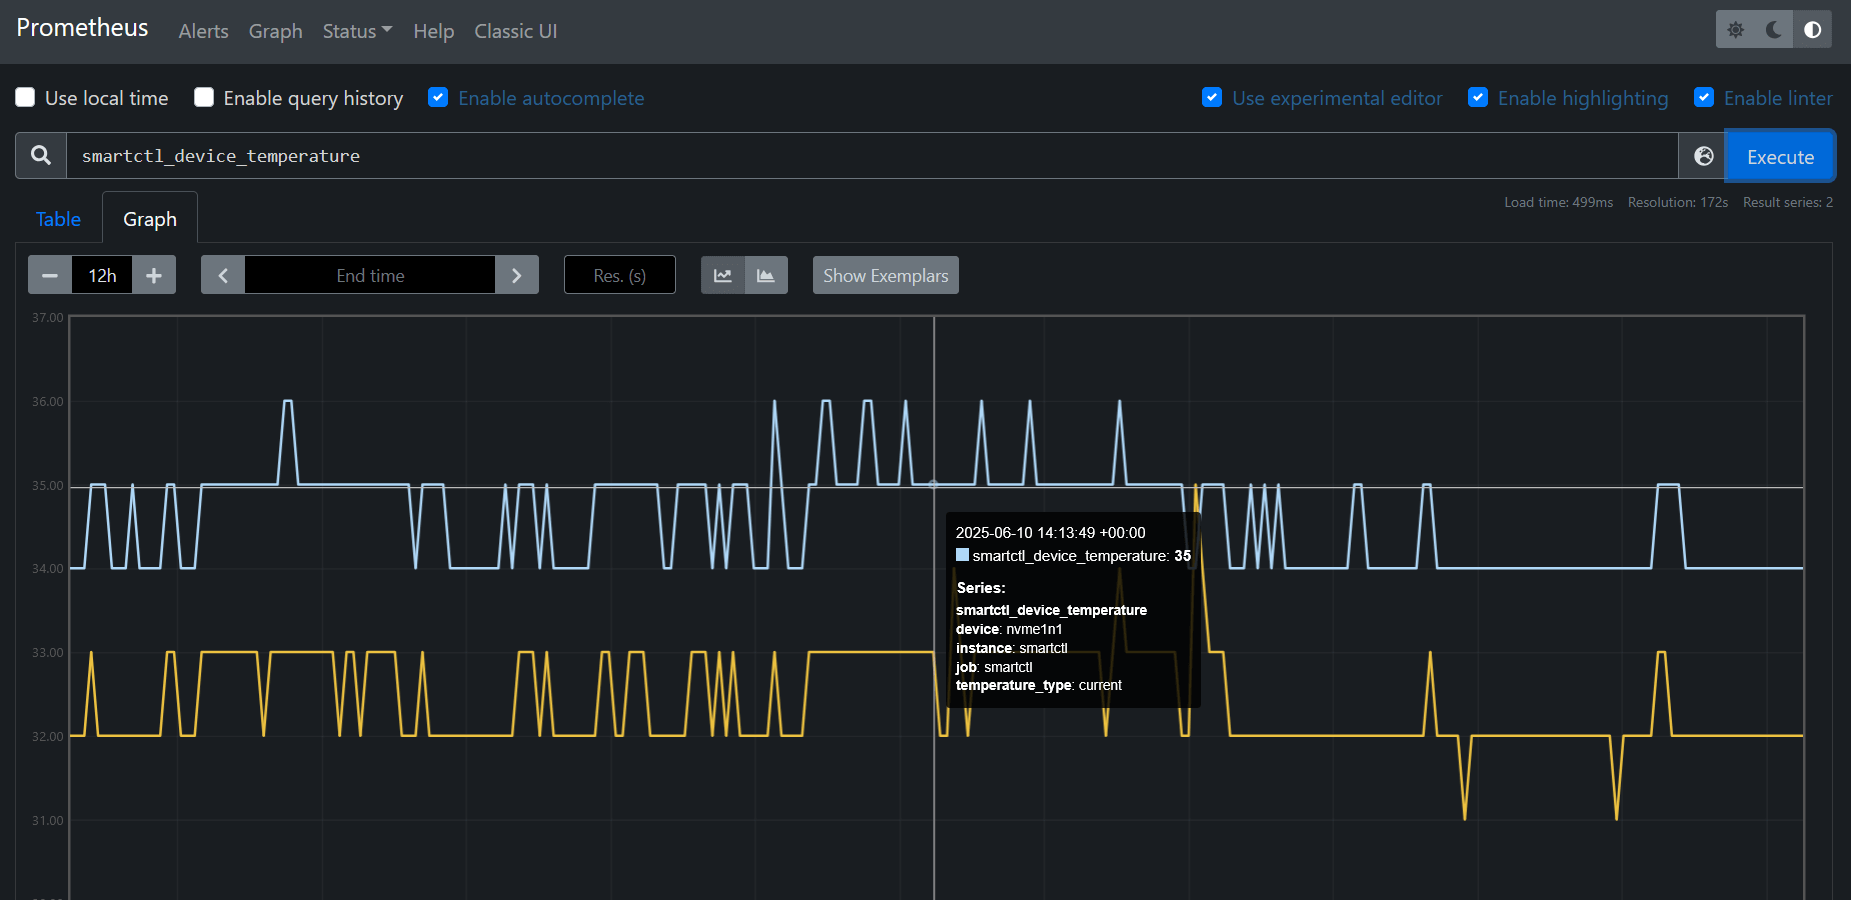
Then reload Prometheus or restart the service. Once loaded, your SMART metrics will be available for querying via PromQL:

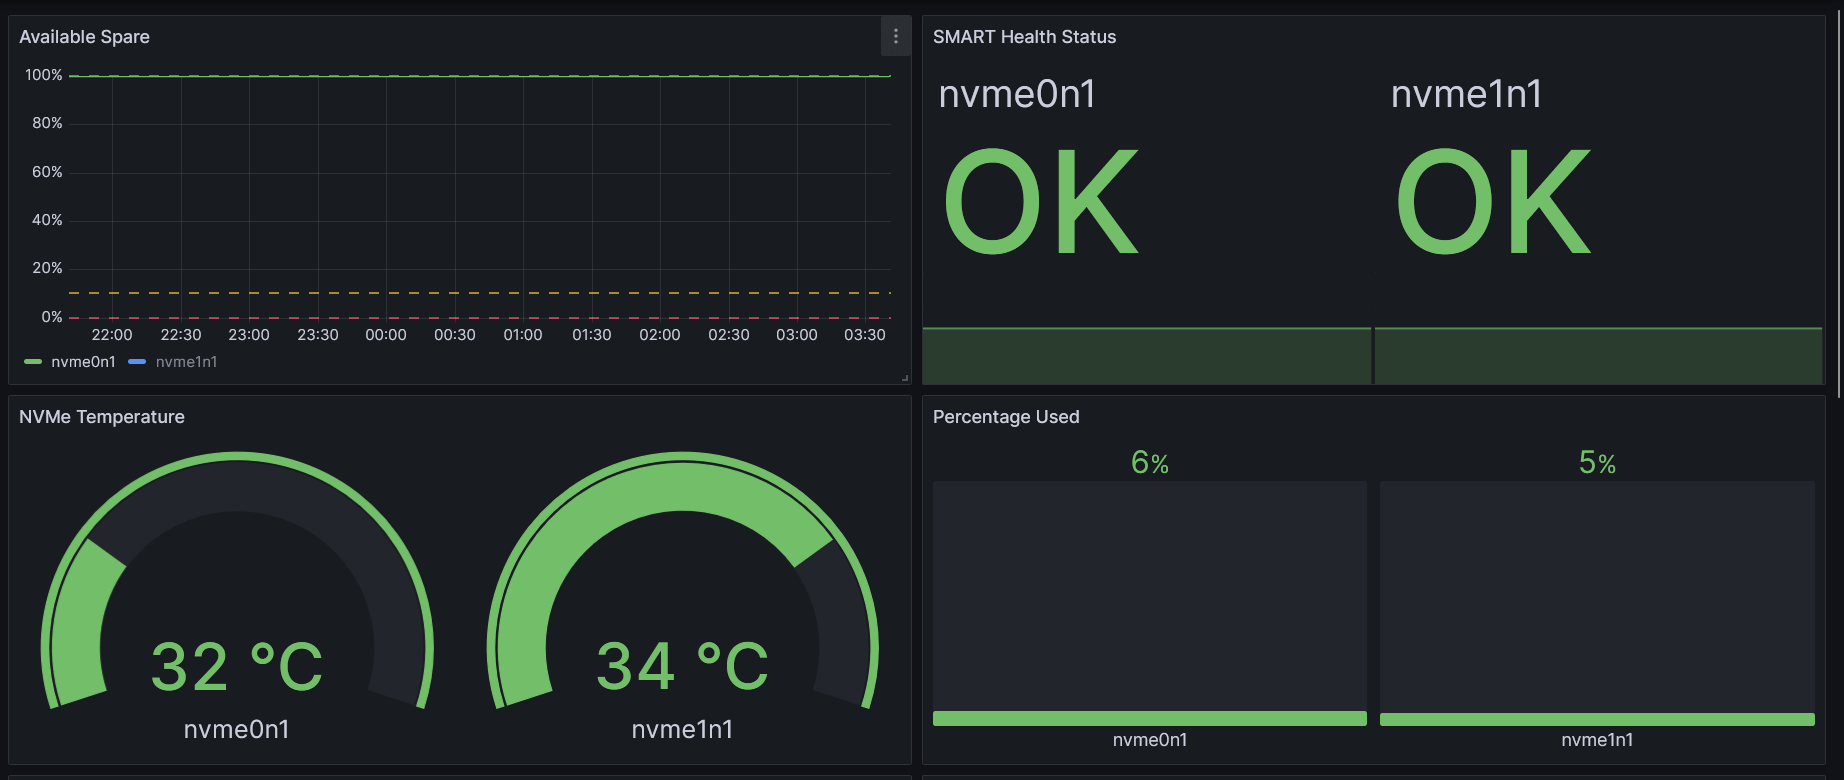
Recommended Grafana Panels for SSD Monitoring
To visualize the health and usage of your SSDs, you can create a custom Grafana dashboard with the following panels. These metrics are collected using the smartctl-exporter and exposed to Prometheus.
| Panel Title | PromQL Query Example | Panel Type |
|---|---|---|
| NVMe Temperature | smartctl_device_temperature{temperature_type="current"} |
Gauge |
| SMART Health Status | smartctl_device_smart_status (1 = OK, 0 = FAIL) |
Stat |
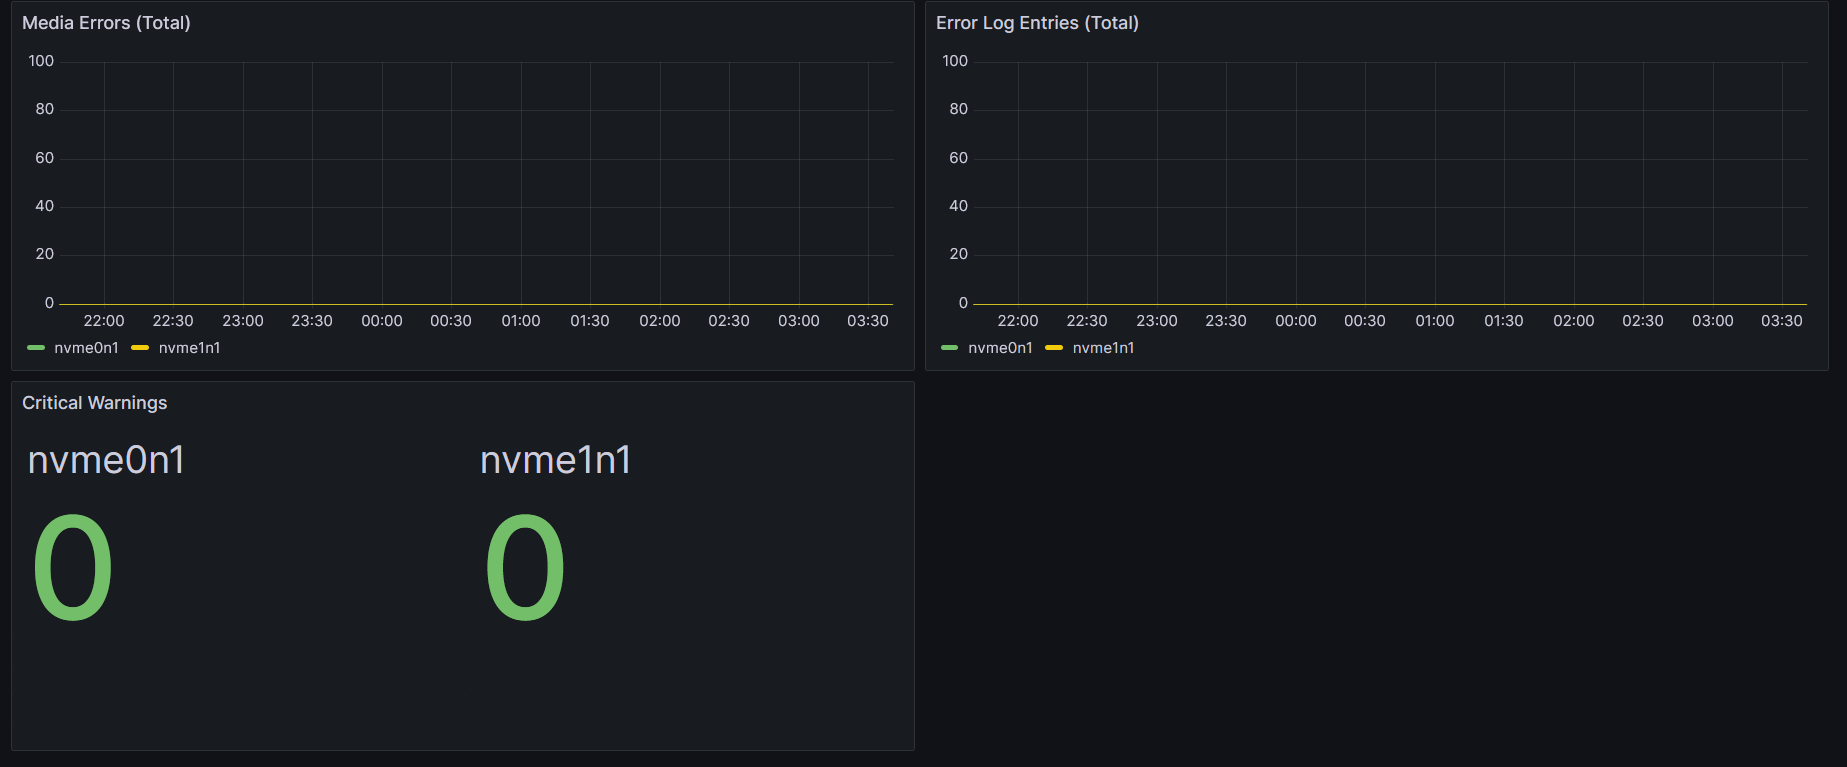
| Media Errors (Total) | smartctl_device_media_errors |
Time series |
| Error Log Entries | smartctl_device_num_err_log_entries |
Time series |
| Percentage Used | smartctl_device_percentage_used |
Bar gauge |
| Critical Warnings | smartctl_device_critical_warning |
Stat |
| Available Spare | smartctl_device_available_spare |
Gauge |
This set of panels gives a comprehensive real-time view of SSD health and aging, making it easier to catch potential failures early.
Here’s how it looks in my setup:
That's all. You can find the full dashboard JSON and configuration files on GitHub.